Sunday 10 May 2015

Climate change: the science is settled

The slogan "the science is settled" is mainly a rhetorical tool of the mitigation sceptics: A nice strawman to shoot down. When someone does say "the science is settled", what they are telling is "I do not want to talk to you about this".

Climatology is a mature science by now:
The basic results have not changed in decades,
the basics are based on natural science, where clear answers are possible,
a lot of scientists are involved,
climatology is well networked into the other sciences and
colleagues from other disciplines regularly contribute.

In such a situation, I find it perfectly normal for a citizen or politician to respond to outlandish claims of mitigation sceptics with: "Listen chap, you and I are both not qualified to discus such details. For me it is good enough that almost all scientists agree that there is a problem. If you really have a problem with some detail of the science, go write a scientific paper about it, but do not bother me with it." Or for short: "The science is settled".

You will have to search long and hard to find a scientist saying "the science is settled". Mostly because that is not how we scientists think: we are working on trying to improve our understanding and focus on the interesting parts that are not well understood. But when someone claims to have refuted the greenhouse effect, I feel perfectly entitled to say "the science is settled".

Some people even claim that greenhouse gasses cool the atmosphere. Sorry my life is too short to waste on such people. Some people even claim that the increases in CO2 are not man made. Sorry my life is too short to waste on such people.

Not only is there an overwhelming consensus on these topics, these are also topics that are pure natural science and they deal with the present or recent past. For such questions, an overwhelming consensus signals that the evidence is clear. I do not overestimate myself and think I can just barge in and explain the local experts what they are doing wrong. If someone else wants to do so, fine, they can write a scientific article about it. If they do not have the skills to write a scientific article, it is a legitimate question how it is possible that they are so sure that the science is wrong.

When someone asks me about the removal of non-climatic changes (inhomogeneities) from climate data, I can naturally not just answer "just trust me". That is my field of expertise and people have a justified expectation that I am able to answer such questions.

There are limits to this expectation. Eric Worrall recently asked on this blog: "How do you know the climate didn't actually cool?". And also did not provide any arguments. That signals such a degree of extremism that it makes no sense to talk to someone like that. A similar question from a scientist would also be another matter, but Worrall comes from a group that is known for misinformation and deceit. A reasonable answer would thus be: "the science is settled". Because it was here at my blog and he is somewhat known in mitigation sceptical circles, I actually mentioned the various lines of independent evidence that the world is warming. Then he was no longer interested in the discussion.

"The science is settled" is especially well suited for politicians. And they seem to have picked up this strawman lately. Seepage? Mass media are important for politicians and a short snappy slogan makes it more likely that your message is transported. Politicians are unfortunately supposed to extrude confidence and thus prefer not to explicitly say that they are not qualified. Good scientists should know the humble limits of their expertise. They can signal that they are good at science by acknowledging that the "question" is not their field of expertise. Unfortunately, scientists are also humans and some age groups and some fields of study seem to have more problems with admitting any limits.

Politicians may also like it that the slogan is rather ambiguous. The greenhouse effect itself is well understood. That greenhouse gas concentrations are increasing due to human activities is well understood. That CO2 emissions from fossil fuels, deforestation and cement are the main reason also. That it will continue if we do not change our energy system is also clear. However, what the future will exactly bring, how much the temperature will increase exactly is uncertain, if only because no one can predict how much CO2 we will emit before action is taken.
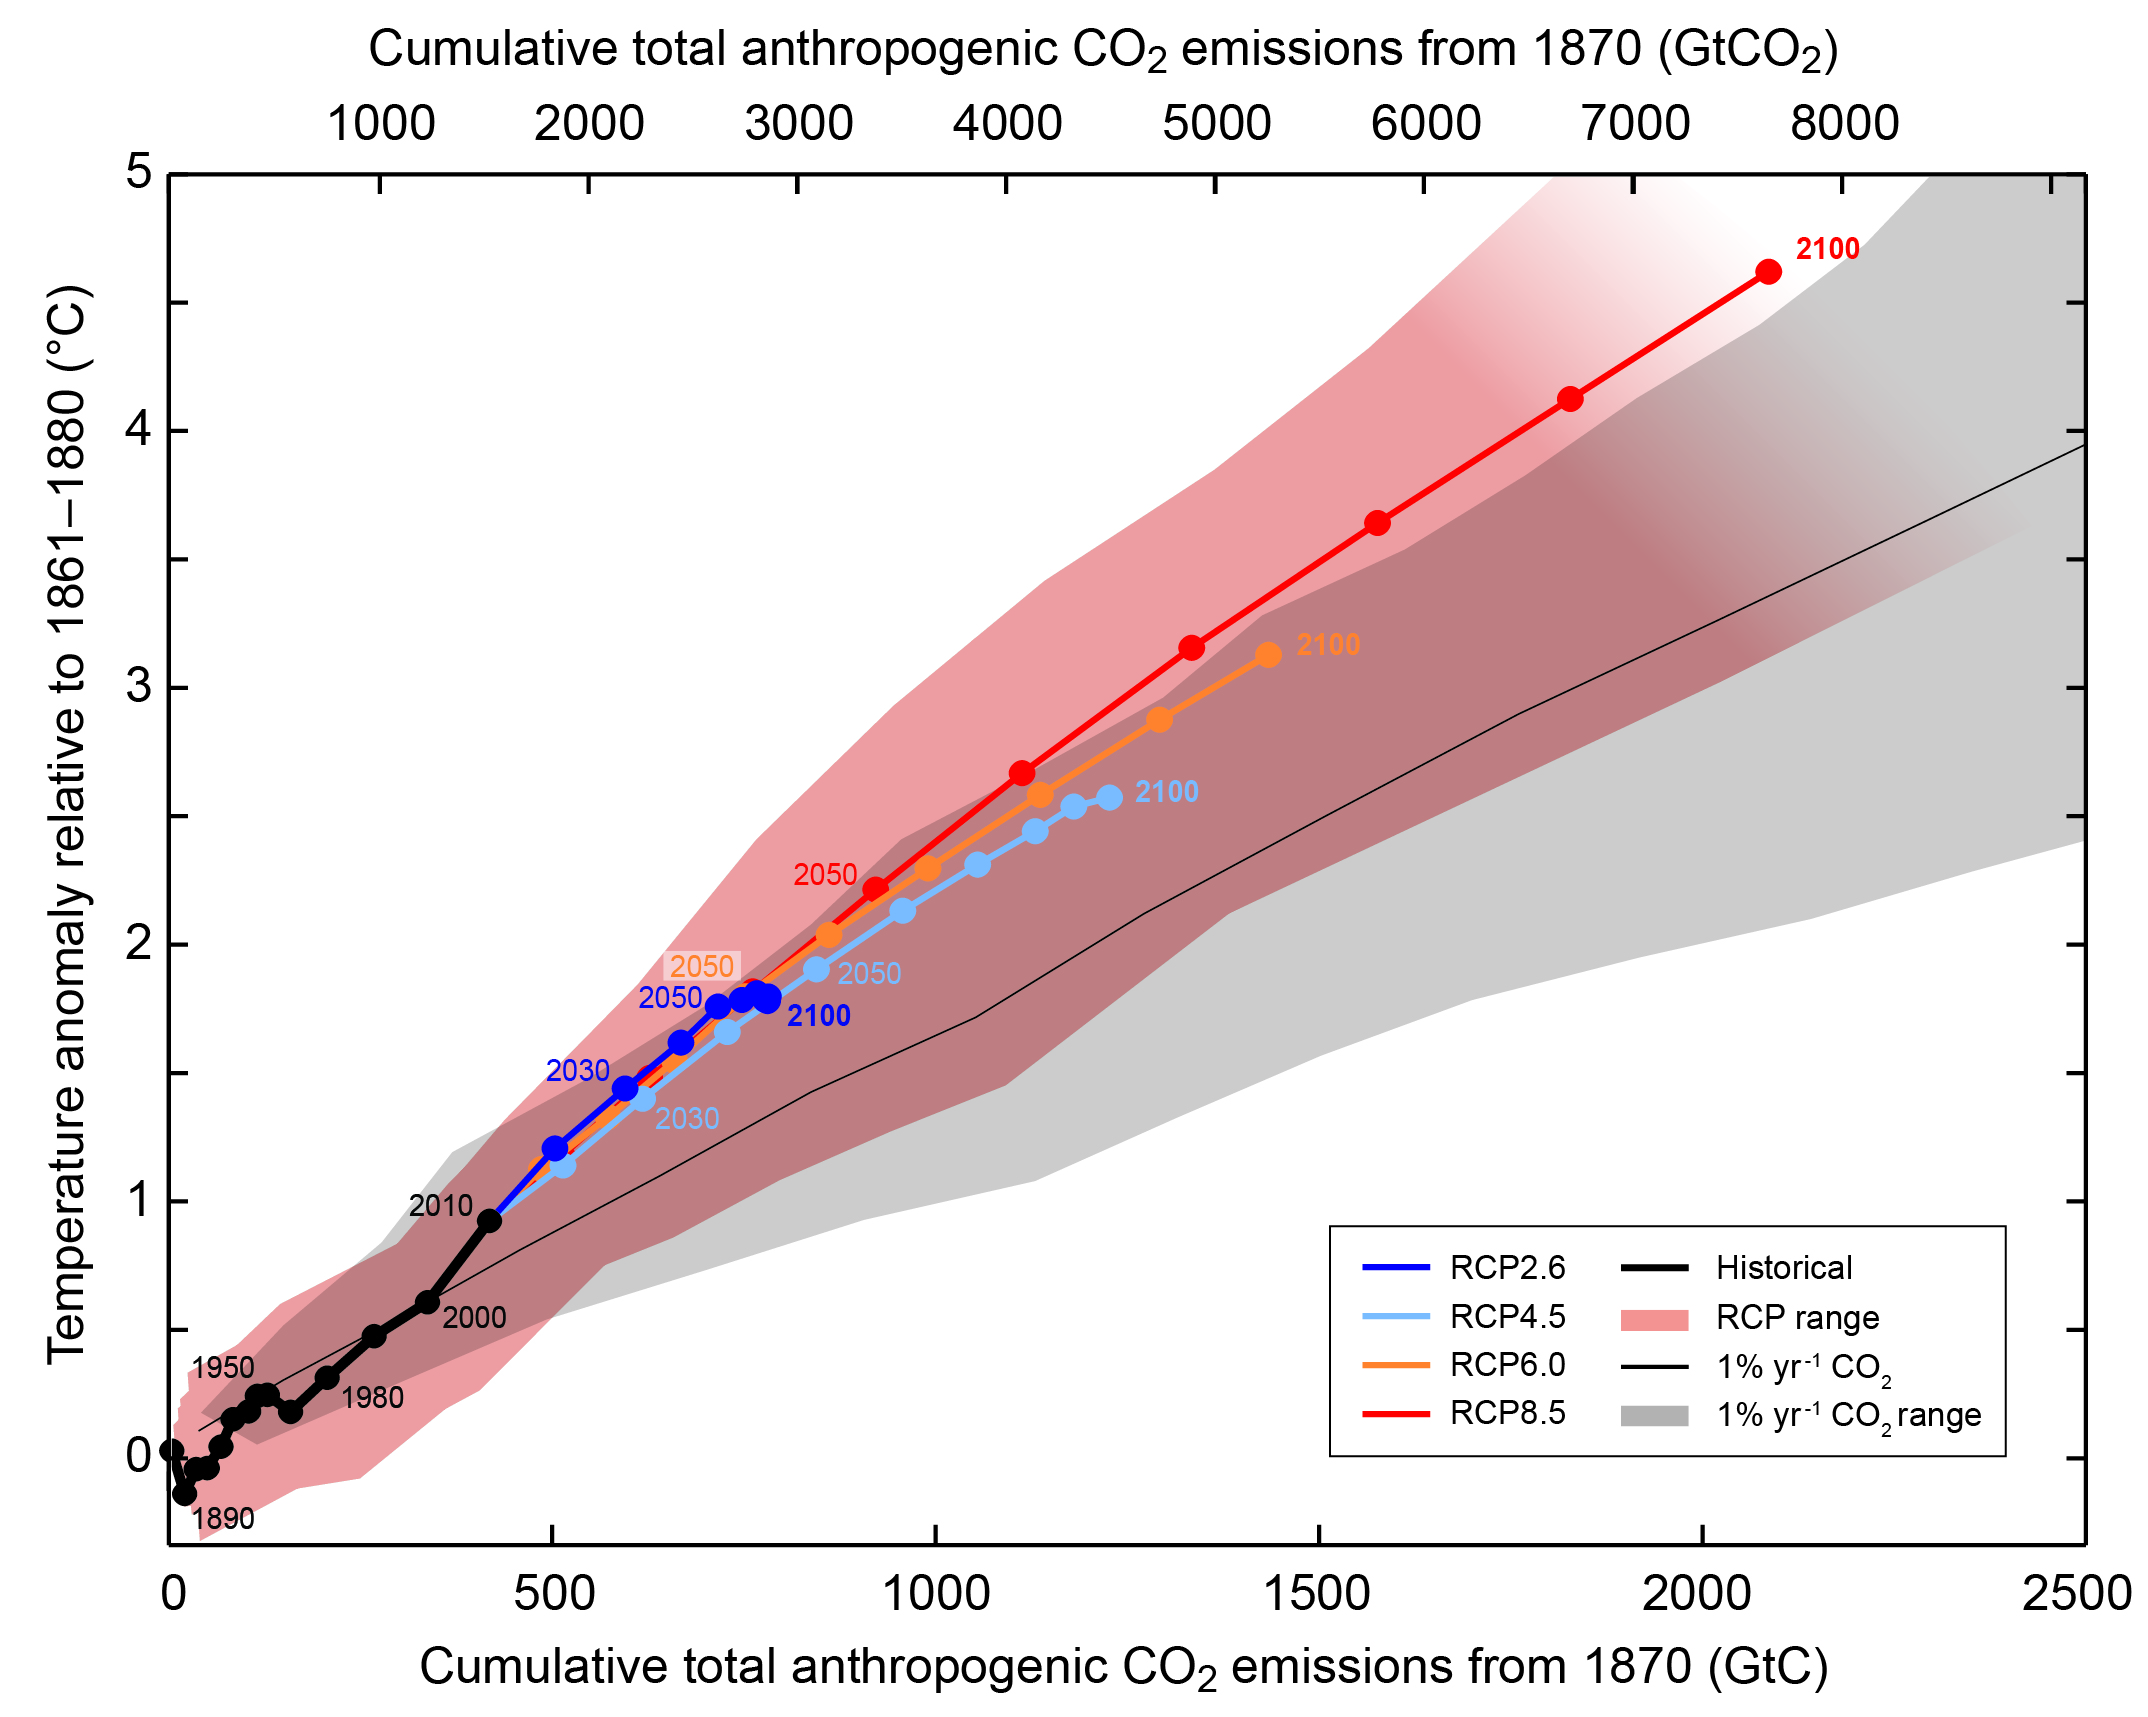


Also which impacts will be how big is quite uncertain. That is actually what worries me most. We are taking the climate system, on which our civilisation depends, outside the range we understand. There will be many (unhappy) surprises. The uncertainty monster is not humanities friend.

Thus, dear reader, please do not ask me why CO2 is a greenhouse gas, why the greenhouse effect does not cool the atmosphere, or even less interesting mitigation sceptical questions from the list of Skeptical Science. The science is settled!! But feel free to ask any questions on homogenization methods, about non-climatic changes in the historical stations measurements or why I am sure the climate is not cooling.

[UPDATE. Just remember a memorable quote by Justin Haskins, a blogger and editor at Heartland, a pro smoking and fossil fuel think tank: “The real debate is not whether man is, in some way, contributing to climate change; it’s true that the science is settled on that point in favor of the alarmists.” If he can, anyone can use the slogan: the science is settled.]


Related reading

The US Republicans signal that the science is settled, that there is no need for further climate research and in doing so put the American public in harms way.

Climatology is a mature field

A collection of early citations on settled science

Thou shalt not commit logical fallacies

Thursday 7 May 2015

Extending the temperature record of southeastern Australia

This is a guest post by Linden Ashcroft. She did her PhD studying non-climatic changes in the early instrumental period in Australia and now works at the homogenization power house, the Centre on Climate Change (C3) in Tarragona, Spain. She weekly blogs on homogenization and life in Spain.

This guest post was originally written for the Climanrecon blog. Climanrecon is currently looking at the non-climatic features of the Bureau of Meteorology’s raw historical temperature observations, which are freely available online. As Neville Nicholls recently discussed in The Conversation, the more the merrier!


Southeastern Australia is the most highly populated and agriculturally rich area in Australia. It’s home to our tallest trees, our highest mountains, our oldest pubs and most importantly, our longest series of instrumental weather observations. This makes southeastern Australia the most likely place to extend Australia’s instrumental climate record.

The official Australian Bureau of Meteorology was formed in 1908, bringing standard observing practices into effect across the country. Before this time, Australian weather station coverage was not as dense as today’s network, and there was no nationally-standard procedure for recording temperature.

The uncertain quality of the pre-1910 data and the lack of readily available information about observation techniques is why the current high-quality temperature dataset available for Australia does not begin until 1910. However, this does not mean that valuable observations were not taken in the 19th century, or that the spatial coverage of these data is too poor to be useful for studies of regional climate. Here, I explain what colleagues and I did to extend the temperature record of southeastern Australia.

When is the temperature not the temperature?

First of all, it’s important to know what ‘non-climatic’ influences can affect temperature observations. Some influences are fairly obvious: if you move a thermometer 20km down the road, change the time of day that the temperature is recorded, or replace the screen the thermometer is housed in, that will most likely cause changes in the data recorded at that station which are not caused by actual changes in the surrounding air.

Other non-climatic influences are more subtle. The slow growth of a tree next to a thermometer for example, or changes to the irrigation system in nearby paddocks can cause gradual changes to temperature observations that are not a reflection of the temperature in the wider area.

Adelaide_screens

Three thermometer screens used in Adelaide, South Australia, in 1890: a Stevenson screen (left), a thermometer shed (centre), and a Glaisher stand (right). Charles Todd famously recorded the temperature in each of these screens for around 40 years, giving us invaluable information about the effect of different screens on temperature observations. Image: Meteorological Observations Made at the Adelaide Observatory, Charles Todd (1907).

Finding and reducing the impacts of these non-climatic influences is an important part of any climate change research. A multitude of statistical methods have been developed over the last 30 or so years to do this, ranging from the beautifully simple to the mind-bogglingly complex. Most of these methods rely on reference series, or a version of the truth with which you can compare data from the station you’re interested in. Reference series are often made using data from neighbouring weather stations that experience a similar climate. Of course this is much harder if you don’t have many neighbouring stations, or if a change in observation method happens at all stations at once! This is another reason why Australia’s national temperature record does not extend before 1910.

As well as these statistical tests, it’s also really useful to have information, or metadata, about the maintenance and changes that occur at a weather station. Metadata help you understand why a non-climatic influence might occur in the climate data, and how big it could be. In reality though, metadata can be hard to find.

Extending southeastern Australia’s temperature record

My work with the South Eastern Australian Recent Climate History project (SEARCH) set out to explore the quality and availability of climate data for Australia before 1908. Our aim was not to look at extreme events, or the exact temperature value at a particular location in a particular month, but to see how the average temperature across southeastern Australia varied over years and decades. This is important to note because if we were studying extremely hot months for example, or only the climate of Wagga, we might have used different methods.

The first step was looking for long-term temperature stations in southeastern Australia. Although the Bureau of Meteorology only started in 1908, a number of weather stations were set up in capital cities and key country towns from the late 1850s, thanks to the dedication of Australia’s Government Astronomers and Meteorologists

My colleagues and I also uncovered some sources of pre-1860 instrumental climate data for southeastern Australia that we painstakingly digitised and prepared for analysis. You can read more about that here.

Next, we spent a lot of time collecting information from the Bureau of Meteorology and previous studies about possible changes in station locations and other things that might affect the quality of the observational data. For some stations we found a lot of photos and details about changes to the area around a weather station. For others, particularly in the pre-1860 period, we didn’t find much at all.

After getting all this information and removing some outlying months, we tried to identify the non-climatic features of the temperature observations, and remove their influence. For the pre-1860 data this was particularly difficult, because we did not have a lot of metadata and there were no nearby stations to use as a ‘truth’. In the end we looked for large changes in the data that were supported by metadata and by the behaviour of other variables.

For example, a drop in temperature in the 1840s at some stations occurred at the same time as an increase in rainfall, suggesting that the temperature change was real, not due to some non-climatic influence. We also noted any other issues with the data, such as a bias towards rounding temperature values to the nearest even number (a common issue in early observations).

For the post-1860 data, we applied a 2-stage process of removing the non-climatic factors, using the statistical RHtest developed by members of the international Expert Team on Climate Change Detection and Indices (ETCCDI). The first stage looked for absolute non-climatic features: big jumps in the data that were clearly instrument problems or station changes, and that were supported by the metadata.

The second stage used reference series made from the average of data from up to five highly correlated neighbouring stations. Both stages involved carefully comparing the statistical results with the metadata we had, and making a decision on whether or not a non-climatic feature was present. You can read more about the methods here.

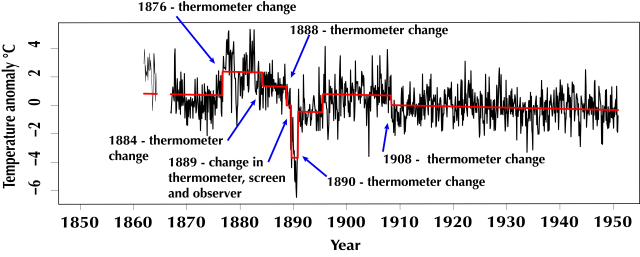
Newcastle_Tmax

An example of the non-climatic features, or jumps, found in Newcastle maximum temperature data from 1860–1950 using the RHtest method. The supporting metadata are also shown. Image supplied by author.

So what did we find?

Our results for the 1860–1950 period found 185 non-climatic features in the maximum temperature data, and 190 in the minimum temperature data over the full network of 38 stations. Over 50% of these non-climatic features identified were supported by metadata, and most of them occurred from 1880 to 1900, when the thermometer shelters that were used in Australia were changed from Glaisher stands to Stevenson screens.

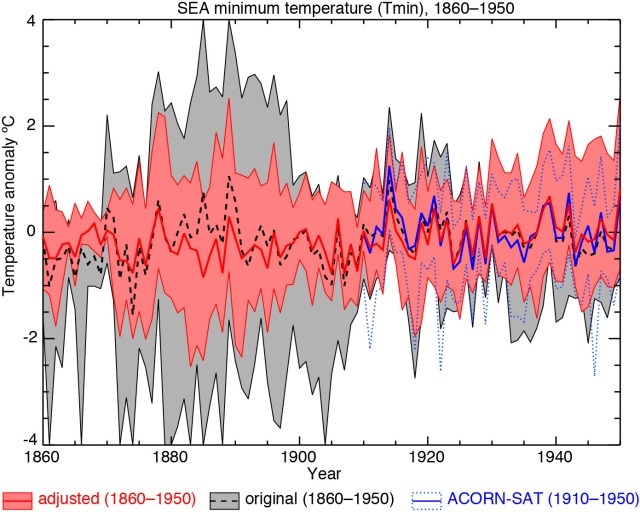
You can see in the figures below that removing the non-climatic features had a big impact on the variance of the observations, making the spread of temperatures across the region much more similar to the post-1910 period, when observations are more reliable. Our results also agreed very well with southeastern Australia data from the Bureau of Meteorology’s monthly and daily temperature datasets that have been tested for non-climatic features using different methods.

This good agreement allowed us to combine the area-average of my data with that of the Bureau’s best temperature dataset (ACORN-SAT), building a monthly temperature record for southeastern Australia from 1860 to the present. Combining the two series showed that the current warming trends in Australia are the strongest and most significant since at least 1860.

SEA_Tmin_orig_homog

Original_homogenised_data

Area-averaged SEA annual anomalies (°C, relative to the 1910–1950 base period) of original data from the historical sources (1860–1950, dashed line), adjusted data from historical sources (1860–1950, solid red line) and data from ACORN-SAT, the Bureau of Meteorology’s daily temperature data over SEA (1910–1950, solid blue line) for maximum and minimum temperature over 1860–1950. The maximum and minimum anomalies for each year across the network are also plotted for the original historical data (grey shading with black outline), adjusted historical data (pink shading with red outline) and ACORN-SAT data (blue dotted lines). Adapted from Ashcroft et al. 2012.

The 1788–1860 data had some non-climatic influences as well, but these were much harder to untangle from the true climate signal because there is not as much ‘truth’ to compare to. We identified five clear non-climatic features of the pre-1860 temperature data from three stations, and found that the year-to-year temperature changes of the adjusted data matched up pretty well with rainfall observations, and newspaper reports at the time. The quality and distribution of the pre-1860 data made it impossible to accurately combine the pre- and post-1860 observations, but hopefully in the future we will uncover more observations and can look more closely at the 1788–1860 period.

Our work is one of the first projects to tackle Australia’s pre-1910 temperature data, shedding more light on Australia’s climatic past. This research also makes use of the hard work that was done by some of the country’s scientific pioneers, which is very rewarding to me as a scientist.

But science is always moving forwards, and our work is just one link in the chain. As more statistical methods are developed and additional data uncovered, I’m sure that we, professional and citizen scientists alike, will be able to build on this work in the future.


More information and references:

Ashcroft, L., Gergis, J. and Karoly, D.J., 2014. A historical climate dataset for southeastern Australia. Geosciences Data Journal, 1(2): 158–178, DOI: 10.1002/gdj3.19 (html and PDF). You can also access the 1788–1860 data at https://zenodo.org/record/7598.

Ashcroft, L., Karoly, D.J. and Gergis, J., 2012. Temperature variations of southeastern Australia, 1860–2011. Australian Meteorological and Oceanographic Journal 62: 227–245. Download here (PDF).


Sunday 3 May 2015

Gavin Schmidt, welcome to Hamburg


Neglecting to monitor the harm done to nature and the environmental impact of our decisions is only the most striking sign of a disregard for the message contained in the structures of nature itself.
Pope Francis


Bad Astronomer is mad:
A passel of anti-science global warming denying GOP [USA Republican party] representatives have put together a funding authorization bill for NASA that at best cuts more than $300 million from the agency’s current Earth science budget. At worst? More than $500 million. ... The authorization bill passed along party lines (19 Republicans to 15 Democrats).
Bad Astronomer also reported that last year the Republicans shifted the climate research funding for NOAA towards weather prediction.

John Timmer of Ars Technica adds:
The bill comes a week after the same committee reauthorized the America COMPETES act, which includes funding for the National Science Foundation and Department of Energy. As at NASA, geoscience funding takes a hit, down 12 percent at the NSF, with environmental research from the DOE taking a 10 percent hit.

There seems to be a pattern.

One wonders if they know what they are doing.

I would personally interpret a reduction in the budget for climate research as claiming: the science is settled. If these Republicans were sceptical about climate science, they would want to fund research to find the reason for the misunderstanding. The consensus of 97% of climate scientists, myself included, that global warming is happening, is caused by us and will continue if we do not do something, will not go away by itself. That will require research, arguments, evidence. In this light it would make sense when Democrats would shift science funding from climate research to climate solution, but they may realise that there are more considerations.

It also goes against the motto of the mitigation sceptics that we should help ourselves and adapt to climate change, rather than to reduce greenhouse gas emissions. Because then we should know what to adapt to.

When it comes to the relationship between greenhouse gasses and global mean temperature, our understanding of climate change is pretty solid. Not perfect, science never is, but pretty solid. For adaptation, however, you need local information; global means are not enough. That is a lot harder, that requires that all the changes in the circulation of the oceans and the atmosphere are rightly predicted. It likely depends on aerosol concentrations (small atmospheric particles), on changes in the vegetation, water tables, sea ice.

Many impacts of climate change will be due to severe and extreme weather. Sea level rise, for example, endangers low lying regions, but the sea dikes will breach on a stormy day, thus you also need to know how storms change. Thus for adaptation you do not only need to know the annual or decadal average temperature, you need to know the changes in atmospheric events that happen on short time scales. From minutes to days for severe weather, from weeks to months for heat waves and droughts. This is hard for the same reasons why predicting local changes is hard.

It is not enough to know what happens to temperature, while especially precipitation and storms are very hard to predict accurately. They are, however, very important for agriculture, infrastructure, flood prevention, dikes, and landslides. When it comes to infrastructure or long term private investments, we would need to know such changes decades in advance. Alternatively, you could "adapt" to any possible change, but that is very expensive.

This is the kind of detail we need to prepare our communities to adapt to climate change. This is hard and very much ongoing research. If you are taking the bet that adaptation is enough, it does not seem wise to leave the American public unprepared.

Earth observation is also much more than climate. The same satellites, the same understanding of these measurements and deriving information products from them are used in meteorology. One of the main reason why casualties due to severe weather are decreasing is because of good weather predictions, we see the bad weather coming and can respond in time. Good weather predictions start with a good description of the state of the atmosphere at the start of the weather prediction (called [[data assimilation]]). More computer power, better models, better assimilation methods and detailed global Earth observations are responsible for the improved modern weather predictions. My guess would be that the better observations are easily responsible for half of the improvements. While I work on ground-based measurements, I must admit that for accurate weather predictions beyond one or two days the global overview of satellites is essential.

Other applications of Earth observations:
- assisting wildfire managers in wildfire recovery
- supplying farmers with knowledge about when to grow which crops and where
- drought/famine prediction
- the effects of deforestation and natural disasters (such as landslides, earthquakes, hurricanes, etc.) on local communities and surrounding ecosystems
Earth observation is also important to organize the rescue work after catastrophes. Think Hurricane Katrina.


The funding reductions also give the impression that climatologists are punished for their politically inconvenient message. Maybe these Republicans think that they can influence the state of the science by beating scientists in submission. This will not work. Science is not organised like a think tank, which are there to write any bunk that the big boss wants written.

Science is a free market of ideas. Like the free market uses distributed information on how to efficiently organize an economy, science is highly distributed and cannot be controlled from the top. Every researcher is a small entrepreneur, trying to search for problems that are interesting and solvable. Science is organised in small groups. If your group does not function, you'd better get out before your reputation and publication record suffer. Multiple such groups are at one university or research institute. In one country you will find many universities and institutes. All these groups in many countries are all competing and collaborating with each other. Competing for the best ideas, because it is fun and get more possibilities to do research. The currency is reputation.

Your articles are peer reviewed by several anonymous colleagues selected by a journal editor, research proposals are reviewed by several senior anonymous colleagues selected by the funding agency, the university groups and institutes are regularly reviewed by groups of senior scientists. You are competing to be able to collaborate with better groups. This web of competitive and collaborative relations is designed to get the best ideas to float up and to make it hard to apply pressure top down. Add to this researchers who are fiercely independent, intrinsically motivated and do science because they want to challenge themselves, understand the world and measure themselves with the best. At least the majority of people starting with research is intrinsically motivated. The climate "debate" gives the impression that for some the joy of science fades with age.

Even if it would be better for American scientists to shut up and spread Republican propaganda, no one could enforce that, while there are strong enforcement mechanisms for the quality of science. I am sure that most American scientists that would be pressured by the Republicans would still stick to the truth. You get into science because you want to understand reality. Scientists accept low pay and bad labour conditions to do so. If they are no longer allowed to tell the truth, I would expect most scientists to move to another group, to another country or simply to stop.


Punishing scientists for their inconvenient message also send a bad signal to the world. A country with a government meddling in the results of scientific research is not attractive. A large part of the scientists in America come from abroad. New high potentials may now think twice before they go to America.

Researchers may go to my birth country (The Netherlands) or home country (Germany)instead. They have freedom of science and research in their constitutions. In both countries you only need English to do your work and nowadays you can also get by in daily life with English (although I would still advice to learn the local language for better social integration). For Germany I know that we are always looking for good scientists. Too little students start studying meteorology to fill the vacancies. They even took me as a physicist because they could not get any better.

In the 17th century, when in most of Europe's rulers did not tolerate deviating thoughts, The Netherlands was a haven of tolerance and experienced a golden century. This little country attracted an enormous influx of the best scholars, scientists and artists from all over Europe, introduced many free market innovations, became a world power. Before and during the Second World War many Jewish and German scientists migrated to America because of the repression in Europe. This has kick started American science. The repression of scientific freedom has real economic and cultural consequences.

One wonders if they know what they are doing. The GOP representative, that is. They almost unanimously have trouble accepting that we are responsible to (almost) all the warming seen in the last century. The normal Republicans (except for the Tea Party) fit into the American mainstream when it comes to accepting that climate change is real. The very vocal mitigation sceptics on the net that give America a bad name abroad only represent a few percent of the population. One wonders when these normal people tell their politicians to get their act together.

In the realm of climate research, my guess would be that Europe is already a little stronger than the USA. The aggressive mitigation sceptics to do not make America more attractive. The FOIA harassment in response to inconvenient science does not make America more attractive. When the political radicals are determined to hurt American interests and pass this bill, I would like to invite Gavin Schmidt to Germany. In am sure the Max Planck Institute in Hamburg would be interested. The Max Planck Foundation was specially founded to attract the best researchers from all over the world by providing them with a lot of freedom of research. After all, top researchers know best what is important for science. Gavin welcome to Hamburg, your [[ICE]] is waiting.


Related reading

Phil Plait (Bad Astronomy blog): House GOP Wants to Eviscerate NASA Earth Sciences in New Budget

Elizabeth Kolbert in The New Yorker: The G.O.P.’s War on Science Gets Worse. "Ignoring a problem does often make it more difficult to solve. And that, you have to assume, in a perverse way, is the goal here."

Discover: House GOP to Humanity on Global Warming: Put on This Blindfold and Keep Marching

John Timmer of Ars Technica: House Science Committee guts NASA Earth sciences budget

Stop all harassment of all scientists now

Peer review helps fringe ideas gain credibility

The value of peer review for science and the press

The Tea Party consensus on man-made global warming

Do dissenters like climate change?

Climate myths translated into econ talk


* Photo at the top of Alster by André H. (An der Alster) [CC BY 2.0], via Wikimedia Commons
* Photo of St. Pauli by Heidas is licensed under the Creative Commons Attribution-Share Alike 3.0 Unported license.
* Photo of Altonaer Balkon in Hamburg by Udo Herzog (http://flickr.com/photos/udo/142872336/) [CC BY 2.0], via Wikimedia Commons
* Photo of Jenisch by Wolfram Gothe (Transferred from de.wikipedia) [Public domain], from Wikimedia Commons
* Photo of the main station of Hamburg by Thomas Fries / Lizenz: CC-BY-SA-3.0